The home dashboard & dashlets
When you first log into CiviCRM, you see the dashboard (CiviCRM Home). It displays information about your site and CiviCRM through “dashlets”: reports you can display on your home dashboard. Many dashlets come with CiviCRM by default, and you or your administrator can create others for your organization.
Examples of dashlets that come with CiviCRM include:
- Donor Report: A bar graph of the amount of total contributions.
- Activities: A list of recent activities recorded by CiviCRM. These could include emails sent to constituents, donations made or meetings scheduled in CiviCRM.
- Membership Report: A table summarising information about Members tracked by CiviCRM, broken out by month. It includes the number of Members of each type, total amounts of payments made and the number of contributions made, among other things.
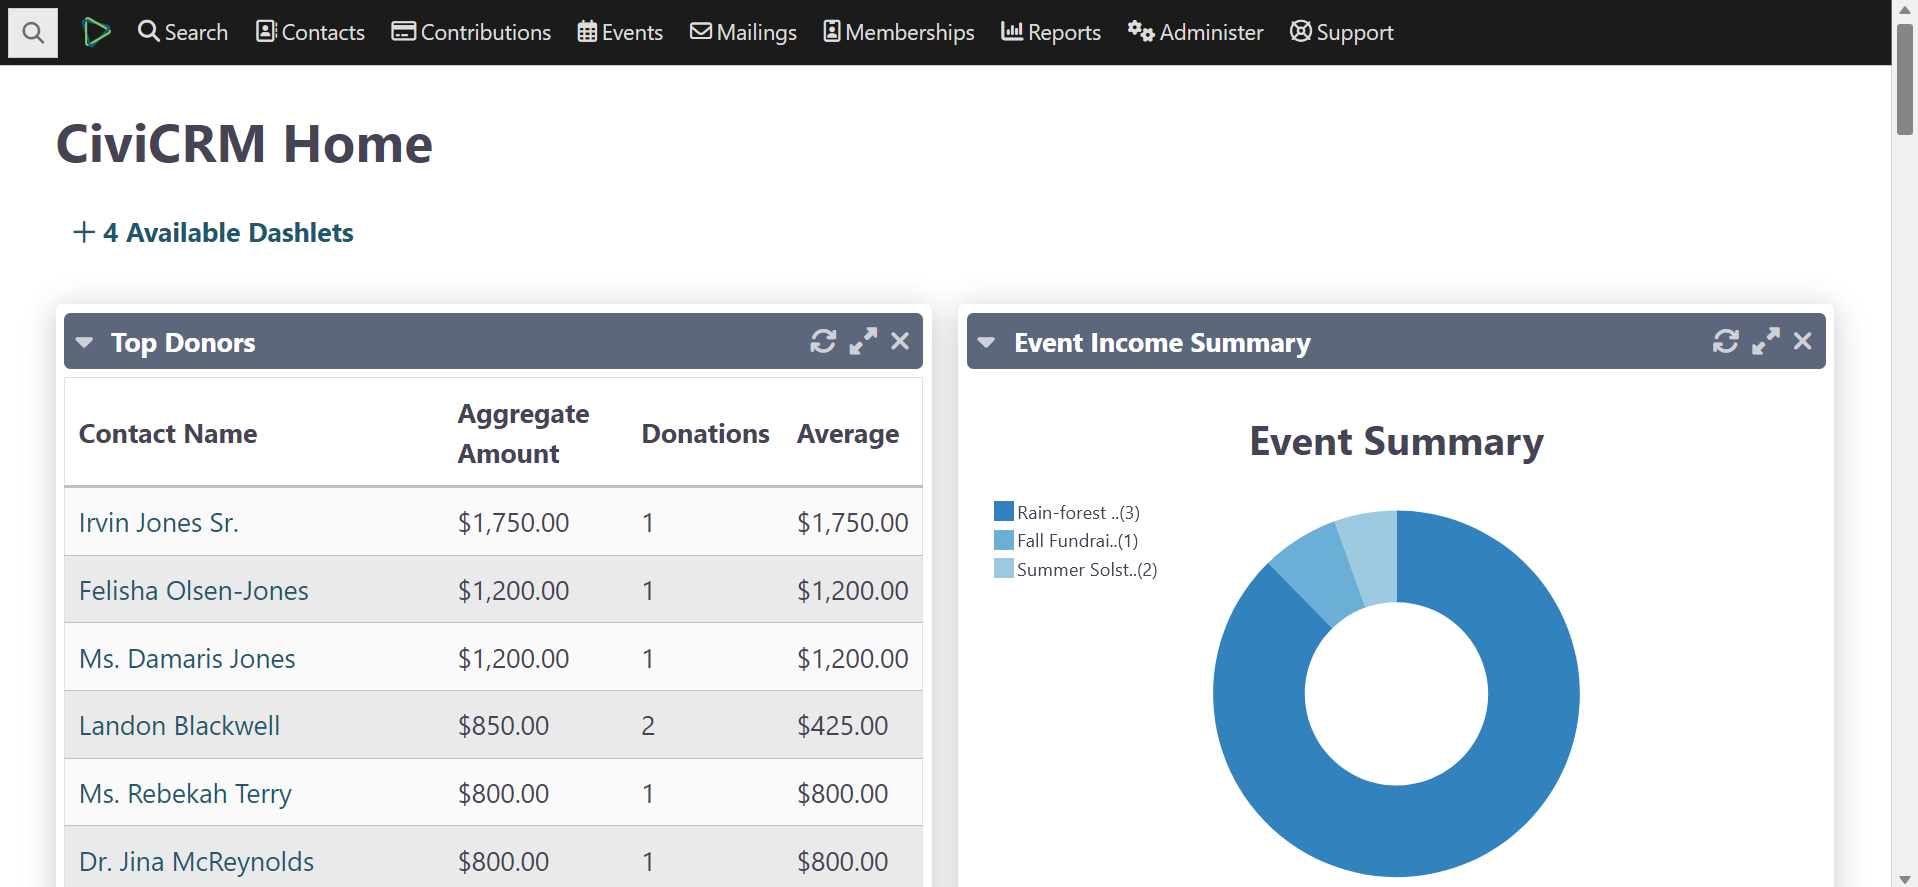
Add and refresh dashlets
Click Configure Your Dashboard to see a list of dashlets. Drag dashlets into the right or left column of your dashboard.
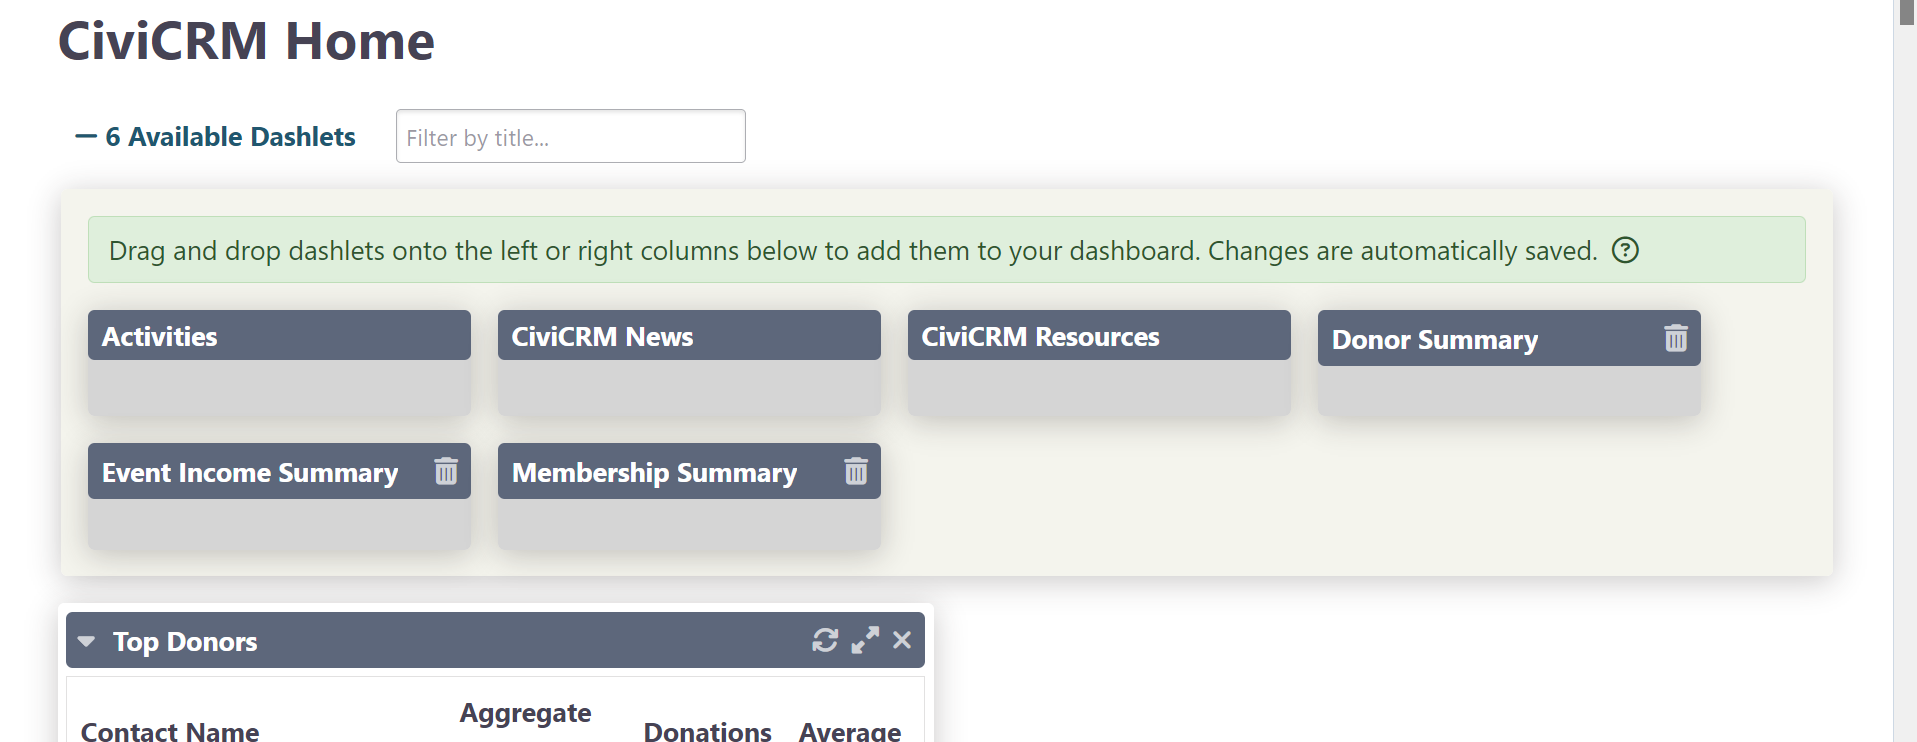
Click Done to save. You will see updates to your dashlets when you log in. To check for more recent changes, click Refresh Dashboard Data to reload each dashlet and pull in new information.
For performance reasons, dashlets are cached. To change how often a dashlet refreshes, edit its report. For example, for the Contribution Summary report:
- Go to Reports > Contribution Reports and click Contribution Summary.
- Under the Access tab, find Cache dashlet for. If that option is unavailable, first select Available for Dashboard?.
- Click Actions > Save.
Create a dashlet from a report
Any CiviReport can be made available as a dashlet.
- Click Reports > My Reports, then click New Report.
- Select the report template you want to use.
- Configure the report using the Columns, Sorting and Filters tabs. For example, you can use the “Date Received” filter to show data for “This Quarter” or “This Year”.
- Click View results.
- Choose Tabular, Bar Chart or Pie Chart from the dropdown to the right of the Actions dropdown.
- At the bottom of the Access tab, select Available for Dashboard?. Users with permissions to see that information will be able to add the dashlet. See permissions for more information.
- Click Actions > Create Report.
Then add the dashlet to your dashboard:
- In the menu, click the CiviCRM logo, then CiviCRM Home.
- Click Configure Dashboard. Drag the dashlet from “Available Dashlets” to the column where you want it.
- Click Done.
See Reporting for more details on working with reports.
Note
You can now use SearchKit with FormBuilder to add dashlets. See FormBuilder for details.